Structural health monitoring tools and predictive modelling for preventive maintenance of wind energy
18 February 2022
MAREWIND is developing innovative structural health monitoring (SHM) systems for blades and foundation structures of offshore wind farms.
Full-field measuring techniques of wind blade working conditions: hardware, measurements and algorithms
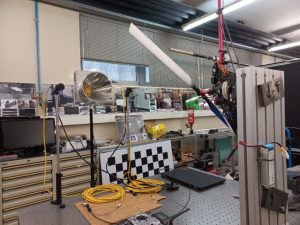
In Task 3.1, INEGI is developing a non-destructive testing system which will be a mock-up of the final blade SHM system to be implemented in the following work packages. This system will consist of the use of a drone-supported configuration to perform digital image correlation (DIC) and thermographic analyses to monitor the appearance of surface and subsurface defects on wind turbine blades. At this stage, INEGI has already worked on the preliminary studies to define and design the laboratory testing setups to be carried out and on the selection of all the necessary equipment (Figure 1). Subsequently, INEGI also started to work on the synchronized trigger and control solution related to the DIC analyses.
Finally, with regard to image acquisition and processing tasks, INEGI has already performed some test setups for DIC and infrared (IR) analysis. For the future, INEGI will focus on the implementation of all proposed configurations for the validation of the proposed technology and will also work on the development of the data analysis software necessary for the implementation of the real-case scenario.
Implementation and assessment of FBGs/DFOs technologies for composite
Likewise, in Task 3.2, INEGI is responsible for the development and implementation of embedded fibre optical (FO) sensors for representative laboratory composite components. As of this date, INEGI has already worked on defining the location of the sensors for all the variables to be assessed, defining the equipment used for each parameter evaluated and started its procurement process.
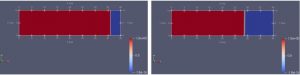
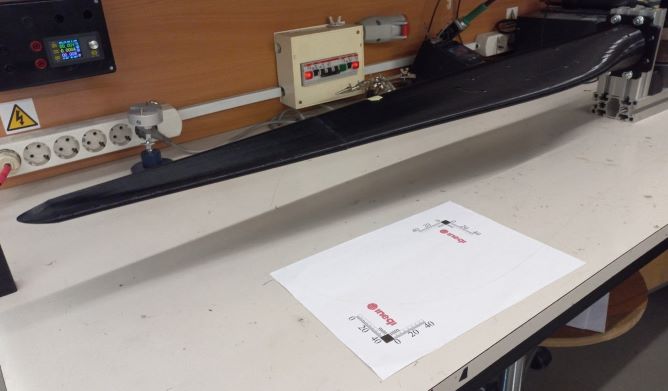
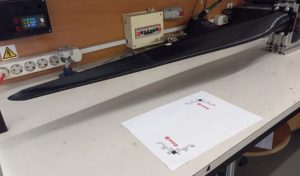
In addition to this, INEGI has already run three test setups with representative parts instrumented with both conventional strain gauges and Fibre Bragg grating (FBG) sensors (2), which allowed to validate the proposed sensor placement, access the sensor bonding process and start developing the data acquisition and processing software. For the future, INEGI plans to complete the execution of all the proposed configurations and to work on the development of the data acquisition and processing software.
In the same Task 3.2, CETMA is responsible for the development and implementation of the innovative SHM system, based on FO, that will be used for monitoring the foundation structures of offshore wind farms. Prototypes of the foundation structures to be built with the new mixtures were defined, based on a new design, in collaboration with the other partners involved; the SHM monitoring system was defined in terms of number and positions of points to be monitored, frequency of acquisition, parameters to be monitored and costs of equipment and sensors. All these parameters brought to the definition of SHM system based on distributed FO sensors to be apply on composite rebars in the concrete structures. In the next months, CETMA will carry out lab trials on the SHM system to demonstrate the suitability of the designed solution to the application.
Water simulations around gravity-based structures
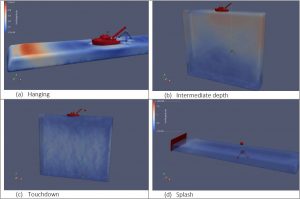
In Task 3.3, INEGI will develop models to recreate the operational conditions of a Ground Based Structure (GBS). These models will consider three scenarios: transport to the installation site, installation and operation. With the information provided by these models and using machine learning algorithms it will be possible to obtain information about the GBS in real environment aiming the decision of the need of maintenance.
At this stage, the Computational Fluid Dynamics (CFD) numerical simulations that model the water flow around the GBS are running, with some results already obtained. This data follows to Fluid-Structure Interaction (FSI) models to quantify the efforts on the GBS (Figure 3). The machine learning models were already developed and are ready to be trained with the data produced by CFD and FSI models.
Structural analyses on composite blades
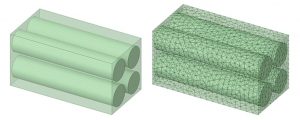
In the period M4-M12, RINA has continued the development of a mathematical model of the composite blade materials by developing the high-resolution finite element model for composite blades (Figure 4). In addition, RINA has developed a MS Excel tool able to perform a preliminary micro- and macro-mechanical analysis on flat composite structures made of unidirectional fabrics. Both the tool and finite element model have been preliminarily validated with a reference composite structure (experimental data available and provided by the partner EIRE Composites).
The next steps will consist in performing a more accurate calibration and validation of the high-resolution finite element model of composite and tool, also testing the in-use materials selected for the development of the prototype. The results will be the basis for conducting the activities referred to the simulation of the blade prototype (or part of it) to predict the fatigue life of the wind turbines.
Modelling of corrosion in atmosphere-exposed metallic structures
From month 6 to month 12, IDENER continued the formulation of a corrosion mathematical model that considers the protection of the metallic surface with an anticorrosion coating layer. The model simulates the dynamics of the interface between the coating and electrolyte. The first version of the model has been implemented in a computational environment, in one and two dimensions, and tested with variable input to detect anomalies in the generated results or convergence issues. In the following steps, the new corrosion experimental results generated by the partners Lurederra, TECNAN and INL will be analyzed and used for the calibration of the model.